Overview
In March 2018, City of York Council (COYC) Transport Systems Team were awarded £2.85m from the Government’s National Productivity Investment Fund to proceed with STEP (Smart Travel Evolution Programme). York is a relatively small City that is surrounded by Roman Walls has many Grade II listed buildings. There is little opportunity for the road network to be expanded therefore COYC needed to address Road Network Efficiency.
STEP Required Transport technology, data collection & processing. A Data Platform. Data visualisation and presentation.
STEP has generated a multi-layered, real-time model of traffic, public transport and air quality data, which allowed York to prepare for connected and autonomous vehicles.
STEP has improved the connectivity and data collection of York’s transport technology assets in order to futureproof how the City deals with changing levels of demand. This scheme has seen the control systems capture data, process it and react to conditions in real-time.
In 2019 City of York Council engaged with TagMaster to trial these new technologies in York to change the way traffic is managed. These trials were successful and employed throughout key locations across York.
Some of the Key Policy Gains COYC were looking to towards were; Road Network Efficiency, Productivity Gains, Emissions Reduction, Congestion Management, Land Use Planning, CAV Readiness, Economic Vitality, City Technology Agenda, Smart City Initiatives.
The Smart Travel Evolution Programme (STEP) will monitor and enable analysis of real-time journey information to improve travel in York.
Solution
This case study details how TagMaster were able to implement a new, modern and connected solution for City of York Council. Below you will find a summary of the most important benefits for COYC:
- Cost effective asset refresh
- Cloud based analytics platform
- Data sharing
- Live SmartMap
- Integrated emissions data
- Site Status
- Congestion highlights
Asset Refresh
Minimising the environmental impacts of procuring a new system by utilising existing infrastructure, such as roadside street furniture, solar panels/batteries, as well as the in ground inductive loops, the migration to a live platform was able to be carried out at a very low cost and breathed new life in to existing assets. COYC upgraded 30% of their current system retro fitting Compact were previous core kit that was in place.
Cloud Based Analytics Platform
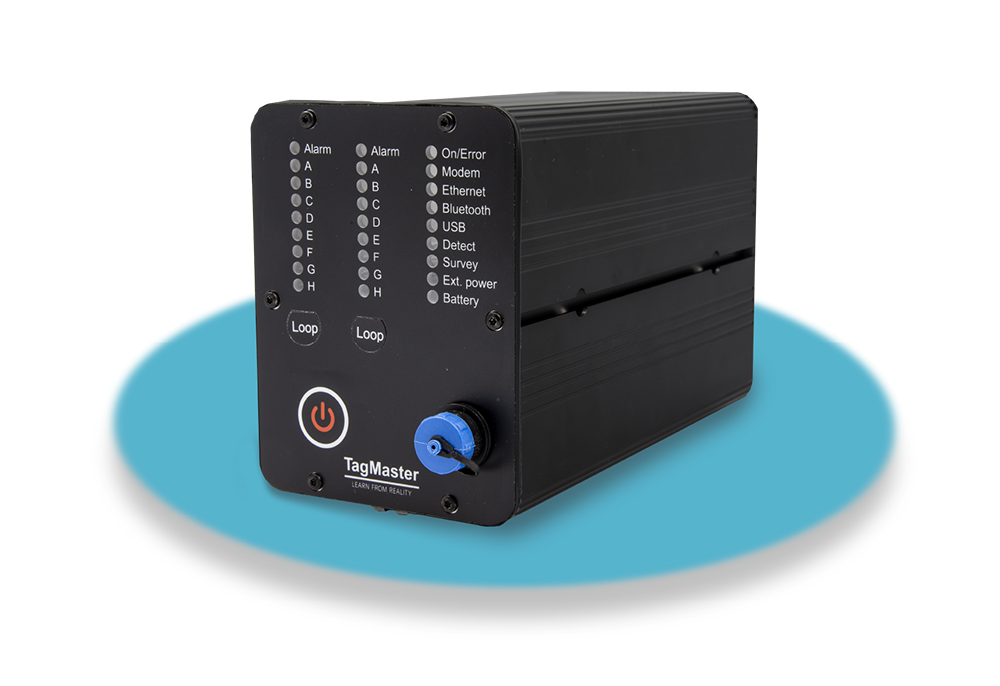
The Compact allows live data to be used for the proactive management of traffic flow. The cloud based TagMaster in-station presents live speed and flow alerts on an interactive map interface, as well as continuing to input data to the mature cloud based data analysis platform of VDA-Net (Vehicle Data Analyser).
Data including, Journey time, Mobility data (trip matrices, Origin / Destination, Link Speed / Congestion can be fed into Agile Modelling Applications. This allowed COYC to achieve their goals and make key decisions to provide better real-time management of the transport network and implement transport policies more effectively.
Data Sharing
Using the web platform for data analysis allows unlimited, but controlled user access. Data can be easily shared with third parties without the need for additional software licences. The user levels can also be controlled to allow only specific data sets to be viewed or for a set amount of time.
Smart Map
The SmartMap (available through VDA-Net) highlights the behaviour of traffic under times of congestion or incidents in real time. From here, all real-time sites can be viewed as live objects. Speed and flow information is displayed, whilst historic trends are used to highlight congestion via the change in icons on the map.
Using the Smart Map you can easily identify when a roads capacity has an impact on the average speed. Site status can also quickly be viewed from a pop up form via the icons.
Emissions
City of York Council have been able to take advantage of the recently developed Emissions Factors Toolkit (EFT) which has been harnessed by TagMaster software. This is provided by DEFRA and in turn combined with a comprehensive data analysis software suite.
Now the EFT has been integrated, all VBV (vehicle by vehicle) data that includes speed and classification information can now have emissions modelling reports run against the data sets. The EFT contains emissions data back to 2015 so any historically recorded data can also have this model applied. Live data can also be seen on the Smart Map alongside congestion information.
Site Status
Site status information can now also be viewed via the web interface, meaning that you don’t need to be out on site to check the site status Communications, signal strength, battery voltage, & sensor status can all be viewed in VDA.NET.
Congestion – Flow v Speed
Rather than a traditional reactive system, congestion can now be monitored based on flow and average speed to provide an early warning system. Measures such as adjusting traffic signal timings, informing of Park & Ride terminals can be implemented to alleveate the congestion.


